The End of Reactive? How Java Virtual Threads Are Making Complex Concurrency Simple Again
Is reactive programming still necessary in Java? This article explores the limitations of platform threads, the cost of reactive programming, and how Java Virtual Threads (Project Loom) offer a simpler path to scalable concurrency — without the complexity tax.
Tue, 17th March 2026
Read MoreBuilding an Interactive TCP Proxy in Rust
Learn how to build a full-duplex TCP proxy with real-time mode switching in Rust. This article covers the challenges of bidirectional forwarding, async I/O with Tokio, and creating an interactive terminal interface for network testing.
Thu, 27th November 2025
Read MoreSpring streaming response made easy
In this short article, we'll get into stream large size of data through stream as an alternative to the traditional endpoints.
Wed, 10th September 2025
Read MoreBlossoming Intelligence: How to Run Spring AI Locally with Ollama
In this short article, we'll look at how easy it is to create a chat bot backend powered by Spring and Olama using the llama 3 model.
Sat, 11th May 2024
Read MoreReact 19: The long-expected features
React 19 introduces a number of new features that will undoubtedly make the life of react developers simpler. While the release is not yet stable, you can test out the new features using the canary version.
Wed, 17th April 2024
Read MoreGetting started with native java apps with GraalVM
Native Image is a technology to ahead-of-time compile Java code to a standalone executable, called a native image. This executable includes the application classes, classes from its dependencies, runtime library classes, and statically linked native code from JDK.
Wed, 10th April 2024
Read MoreWe've all been there. You want to add observability to your Java service, so you pull in the OpenTelemetry SDK, configure exporters, annotate your endpoints, set up context propagation, and hope nothing breaks. It works, but it's a lot of ceremony just to see what your application is doing.
What if I told you there's a way to get full distributed tracing on a Java HTTP server without touching a single line of application code? No SDK, no agent, no bytecode manipulation. Just eBPF at the kernel level doing all the heavy lifting.
In this article, we'll walk through a minimal demo that proves exactly that.
Adding observability to Java applications traditionally comes with a cost. You need to integrate the OpenTelemetry SDK, instrument your endpoints manually, configure exporters, and manage dependencies. For a large microservices system, this instrumentation overhead can be significant—both in terms of development time and runtime performance.
More importantly, not every application can be instrumented. Legacy services, third-party binaries, or quick prototypes like a simple HttpServer demo don't have the luxury of a rich framework with instrumentation hooks. What if the tracing happened below the application layer entirely?
That's where eBPF comes in.
eBPF (extended Berkeley Packet Filter) is a Linux kernel technology that lets you run sandboxed programs directly in the kernel space. Think of it as a way to hook into system calls, network events, and kernel functions without modifying the kernel source code.
For observability, this means you can intercept HTTP requests and responses at the syscall level—reading the raw bytes flowing through read() and write() calls on socket file descriptors. The application doesn't know it's being observed. No SDK, no agent, no sidecar with HTTP proxying. Just the kernel quietly watching traffic.
Grafana Beyla is an open-source tool that packages this eBPF magic into a drop-in sidecar. It automatically detects HTTP traffic, generates OpenTelemetry-compatible spans, and exports them to any OTLP-compatible backend.
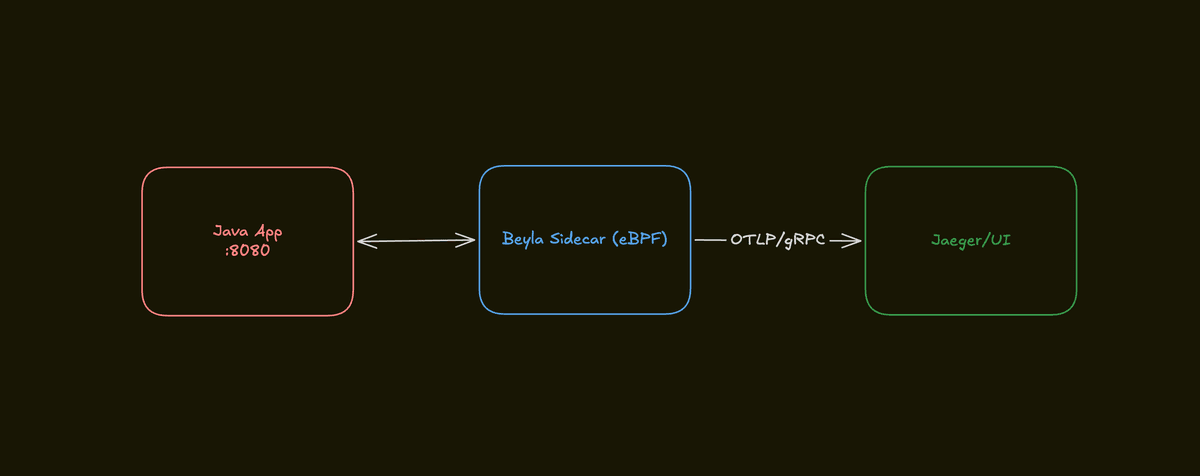
The demo project is a three-container system orchestrated with Docker Compose:

| Component | Technology |
|---|---|
| Java Runtime | Eclipse Temurin 21 JDK (Alpine) |
| HTTP Server | com.sun.net.httpserver.HttpServer (JDK built-in) |
| eBPF Instrumentation | Grafana Beyla |
| Tracing Backend | Jaeger All-in-One |
| Protocol | OpenTelemetry OTLP (gRPC) |
| Orchestration | Docker Compose |
Notice there's no Maven, no Gradle, no Spring. The Java file is compiled directly with javac inside the Dockerfile. This is intentional—it proves that Beyla works on even the most bare-bones Java application.
The application is a single 47-line Java file. Two endpoints, zero dependencies:
The /slow endpoint sleeps for 500ms before responding. This is intentional—it creates a visible latency span in the distributed trace, making it easy to spot in Jaeger.
The Dockerfile is equally minimal:
Here's where the eBPF magic happens. The Beyla sidecar runs alongside the Java container with these key settings:
Two environment variables do all the work:
That's it. No code changes. No SDK dependency. Beyla hooks into the kernel-level syscalls and starts producing traces automatically.
The beyla-config.yml file is actually empty—all configuration is driven by environment variables. This keeps things clean and easy to understand.
Jaeger receives the traces via OTLP/gRPC on port 4317 and exposes its UI on port 16686:
Once the stack is running, open http://localhost:16686 to see the Jaeger UI.
Starting the stack is a single command:
To generate some traffic, run the test script:
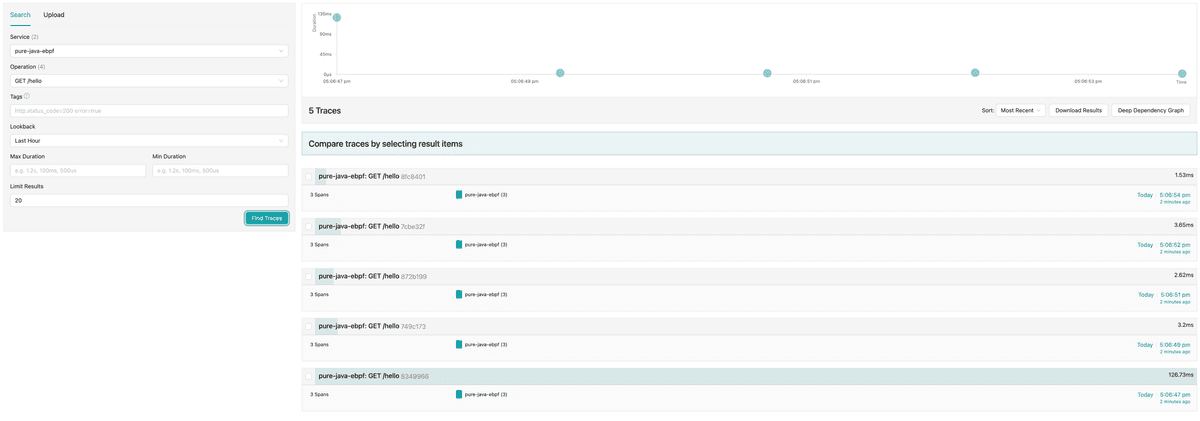
This sends 10 requests (5 to /hello, 5 to /slow) with 1-second delays between each. Now head over to Jaeger and you'll see:
The traces appear because Beyla intercepted the HTTP traffic at the syscall level, parsed the HTTP protocol, and generated OpenTelemetry spans—all without the Java application knowing.

The most important takeaway from this demo is that eBPF-based observability fundamentally changes the instrumentation model. Instead of instrumenting your code (which requires SDKs, agents, and code changes), you instrument at the kernel level (which requires zero application changes).
This has several practical implications:
The tradeoff is that you need privileged access to the host kernel, which isn't always possible in managed Kubernetes environments. But for development, testing, and self-hosted infrastructure, it's a game-changer.
Getting distributed tracing on a Java application doesn't have to mean pulling in the OpenTelemetry SDK and rewriting your endpoint handlers. With eBPF and Grafana Beyla, you can get full observability on a plain Java HttpServer with zero code changes.
This demo is intentionally minimal—47 lines of Java, no frameworks, no build tools. But the principle scales to any Java application. The eBPF layer doesn't care about your framework; it cares about syscalls.
If you've been putting off adding observability to a service because of the integration overhead, eBPF might be the nudge you need.